|
How to make money in the coming economic ‘ice age’
Published: Sept 3, 2015
5:33 p.m. ET
Analysts have a plan for investors to prosper during a sustained period of
deflation in the U.S.
|

Bloomberg News/Landov
A huge increase in overall
debt, combined with currency devaluation in emerging markets, is
likely to lead to a Japan-like period of deflation in the U.S. and
weak returns for most stocks, according to Société Générale
analysts. |
Every day
there are headlines about slowing economic growth in China, and the
country’s
currency devaluation last month
was a catalyst for painful volatility and declines of stocks worldwide.
But these events may point to a longer-term problem that U.S. investors
have to consider.
Overall debt in the United States has continued to grow and is now at
an all-time high, and debt has also shot up in Europe, Japan and now
China. “Combined with adverse demographics, an excessive debt burden
erodes disposable income of people who have to finance the debt,”
according to Société Générale analyst Robbert van Batenburg.
Meanwhile, “devaluation of many currencies in emerging markets
particularly has been driving deflationary trends in developed
markets,” van Batenburg said during an interview on Wednesday.
It
makes plenty of sense for exporters of manufactured goods, worried
about their own economies, to go through competitive rounds of
devaluation in order to boost their exports to developed countries.
The
good news for people in developed countries is the continued flow of
cheaper goods. But there’s a price.
|

Société Générale |
“While
investors have already talked about the eurozone looking similar to
Japan, a deflationary recession also beckons for the U.S.,” Société
Générale strategist Albert Edwards said in a report on July 30.
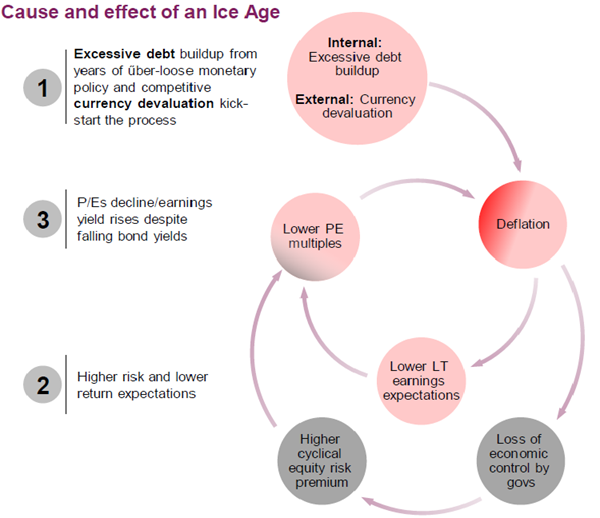
Building on this thesis, analysts from the bank said last week that
this economic “ice age” will lead to higher risk and lower returns for
stocks.
“We’ve
had this deflationary environment in Japan three times, in 1994 to
1996, 1999 to 2007 and 2012 to 2014. We have seen an overall market in
Japan that has led to bonds outperforming stocks,” van Batenburg said.
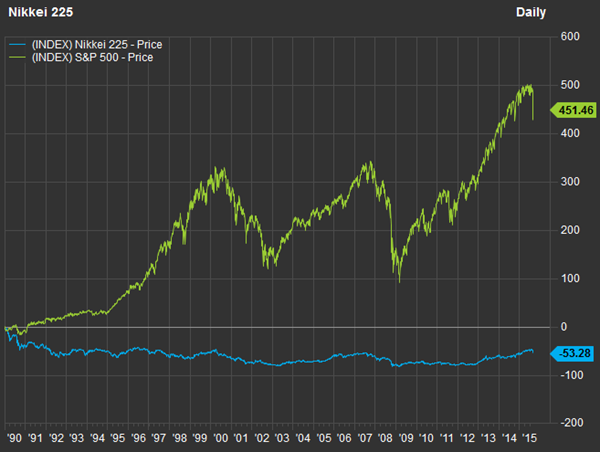
This
chart illustrates just how terribly Japan’s Nikkei 225 Index
NIK, -0.05% has performed, on
a price basis, against the S&P 500 Index
SPX, +0.12% since the end of
1989:

FactSet
Since 1989, the Nikkei 225
index is down 53% on a price basis, while the S&P 500 is up 451%. |
The
aging of the U.S. population will place a further drag on the economy,
with an increasing percentage of people “relying on government support
and entitlement programs, which in turn will push up overall debt,”
van Batenburg said. “The result of all this is a relentless
compression of growth and eventually declining earnings expectations,”
he added.
What to do about it
Considering van Batenburg’s comment about government bonds
outperforming equities in Japan, investors fearing a long-term weak
trend for the U.S. stock market might want to consider an income
strategy. During last week’s market turmoil we discussed various
aspects of
income investing and ways to
limit volatility risk.
Of
course, long-term institutional investors will still be holding stock.
If you still want to go for long-term growth during an economic ice
age, Société Générale has recommended focusing on quality stocks, that
meet these criteria, outlined by van Batenburg:
•
Stable and sustainable profits
•
Strong balance sheet
• Low
debt
•
Ability to fund operations internally
• In a
market with high barriers to entry
•
Strong competitive position
Société Générale incorporated the Piotroski Score, which is a model
developed by Stanford University Associate Professor Joseph Piotroski.
The
ice-age basket of equities recommended by Société Générale includes 43
companies, most of which are headquartered in the United States.
We
can’t include the entire list, but here are the three largest ice-age
basket companies recommended by Société Générale by market
capitalization in each sector, or fewer if there are less than three
in that sector.
We
included five-year average returns on equity as a relative measure of
performance, although it is not very useful to compare ROE across
industries. We also included five-year total returns, even though they
have no bearing on future performance.
Consumer discretionary
|
Company
|
Ticker
|
Industry
|
Average return on equity - past five
fiscal years
|
Total return - 5 years
|
|
Walt Disney Co. |
DIS,
+0.10%
|
Media conglomerates |
13.9% |
223% |
|
Nike Inc. Class B |
NKE,
+0.39%
|
Apparel/ footwear |
23.8% |
223% |
|
Target Corp. |
TGT,
+0.52%
|
Discount stores |
16.9% |
66% |
|
Sources: Société Générale, FactSet |
Consumer staples
|
Company
|
Ticker
|
Industry
|
Average return on equity - past five
fiscal years
|
Total return - 5 years
|
|
Procter & Gamble Co. |
PG, +0.17%
|
Household/ personal care |
16.0% |
36% |
|
PepsiCo Inc. |
PEP, +0.53%
|
Beverages: Non-alcoholic |
30.6% |
63% |
|
Altria
Group Inc. |
MO, +0.87%
|
Tobacco |
109.6% |
203% |
|
Sources: Société Générale, FactSet |
Financials
|
Company
|
Ticker
|
Industry
|
Average return on equity - past five
fiscal years
|
Total return - 5 years
|
|
Loews Corp. |
L, +1.16%
|
Property/ casualty insurance |
4.8% |
3% |
|
Sources: Société Générale, FactSet |
Health care
|
Company
|
Ticker
|
Industry
|
Average return on equity - past five
fiscal years
|
Total return - 5 years
|
|
Johnson & Johnson |
JNJ,
-0.76%
|
Pharmaceuticals |
20.5% |
87% |
|
Pfizer Inc. |
PFE,
-0.25%
|
Pharmaceuticals |
11.6% |
134% |
|
Gilead Sciences Inc. |
GILD, -2.26%
|
Biotechnology |
48.9% |
531% |
|
Sources: Société Générale, FactSet |
Information technology
|
Company
|
Ticker
|
Industry
|
Average return on equity - past five
fiscal years
|
Total return - 5 years
|
|
Google Inc. Class A |
GOOGL,
-1.22%
|
Internet software/ services |
17.2% |
178% |
|
SAP SE Sponsored ADR |
SAP, +0.67%
|
Packaged software |
22.6% |
55% |
|
Total System Services Inc. |
TSS,
+0.86%
|
Data processing services |
16.8% |
240% |
|
Sources: Société Générale, FactSet |
Telecommunications
|
Company
|
Ticker
|
Industry
|
Average return on equity - past five
fiscal years
|
Total return - 5 years
|
|
AT&T Inc. |
T, +0.67%
|
Telecommunications |
11.2% |
57% |
|
Verizon
Communications Inc. |
VZ,
+0.82%
|
Telecommunications |
17.0% |
91% |
|
Sources: Société Générale, FactSet |
|
Copyright
©2015 MarketWatch, Inc. |
|