This
unique mutual fund charges less than an index fund if it underperforms
Published: Apr 7, 2018 7:43 a.m. ET
AlllianceBernstein
fund’s fees are as low as 0.10% a year
|

Bloomberg
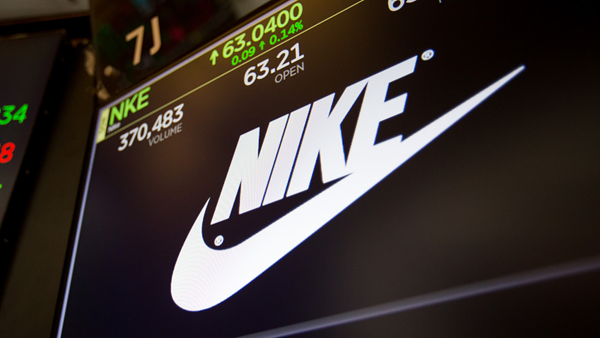
Nike is among companies held by the AB FlexFee Large-Cap Growth
Portfolio.
|
Fund
manager AlllianceBernstein has started what the average investor might
hope for: A flexible set of fees for funds in which the company
receives only a nominal annual fee unless a fund outperforms a
benchmark index.
The
company’s new AB FlexFee Large-Cap Growth Portfolio
FFLYX follows the same
strategy as the $6.5 billion AB Large-Cap Growth Fund
APGYX which has outperformed
its benchmark index over the long term.
Index funds tend to have superior track records against actively
managed mutual funds, in part, because of low fees. For example, the
Vanguard 500 Index Fund’s investor shares
VFINX have total annual
expenses of a very low 0.14% of assets, according to Morningstar
Direct.
A
new approach to active-management fees
According to Frank Caruso, chief investment officer of U.S. Growth
Equities at AllianceBernstein, the FlexFee funds have the “lowest
possible” minimum levels. Caruso is the lead portfolio manager of the
AB FlexFee Large-Cap Growth Portfolio. The fund’s benchmark is the
Russel 1000 Growth Index
RLG
If
the fund’s performance after fees matches that of the index during a
calendar year or trails the index, the management fee is 0.05% of
assets, with another 0.05% charged for expenses, for a total expense
ratio of 0.10%. The fees go up if the fund outperforms the index. The
midpoint for the fees is a total expense ratio of 0.60% if the fund
outperforms the index by 140 basis points. The maximum expense ratio
is 1.10% if the fund outperforms the index by 280 basis points or
more. Through the year, the fund’s net asset value (the share price)
is adjusted daily to reflect whether or not the fund has continued to
outperform the index.
According to Morningstar, the average actively managed large-cap
growth fund (weighted by asset size) has annual expenses of 1.10%,
while the median expense ratio for the category is lower at 0.89%.
Those fees are charged regardless of performance.
Keep
in mind that the new fund is following precisely the same strategy as
the AB Large-Cap Growth Fund, which Caruso has been in charge of since
2012. That fund has many share classes, but according to Caruso, most
new investors purchase the fund’s Advisor-class shares, which have no
sales charge and annual expenses of 0.75%. Here’s how the A B
Large-Cap Growth Fund’s Advisor shares have performed through April 2,
after expenses:
|
|
Average
return - 3 years |
Average total return - 5 years |
Average total return - 10 years |
Average total return - 15 years |
|
AB
Large-Cap Growth Fund - Advisor Class |
12.6% |
16.6% |
12.7% |
11.3% |
|
Russell 1000 Growth Index |
12.0% |
15.0% |
10.7% |
10.4% |
|
S&P 500 Index |
10.0% |
12.8% |
8.9% |
9.7% |
|
Morningstar Large-Growth Category |
9.9% |
13.3% |
9.3% |
9.8% |
|
Sources: Morningstar, FactSet |
Caruso said the new fee strategy “is an opportunity for us to be
disruptive, to align the needs of our clients.” He said
AllianceBernstein is “disrupting the disrupters” — index funds — by
offering a new, safer way for investors to select active management.
After all, if the fund doesn’t outperform the index, investors will
pay only index-fund-level fees.
Outperforming the index
When
discussing the long-term performance of the strategy, Caruso stressed
that the AllianceBernstein’s large-cap portfolio managers and analysts
focus on “the integrity of a business” and “the power of compounding.”
“From our point of view, the investment world is over-indexed to
short-termism,” which he called a “disease,” as evidenced by the
obsession of sell-side analysts and the financial media with
companies’ quarterly “beats or misses” when earnings or sales results
are compared to analysts’ estimates.
“The
only way we can serve our clients is to be different, and that means
focusing on a three-year to five-year period,” Caruso said. His team
of managers and analysts will consider a company’s return on invested
capital (ROIC), as well as the potential for reinvestment of cash to
improve returns over the long haul.
The
idea is for the growth portfolio to consist of solid businesses.
“We
are not starting in that classic chase of finding a good stock,”
Caruso said.
In
other words, he will not buy a stock simply because he believes it is
a bargain. He is more interested in the quality of the company itself
and its ability to grow and improve profit margins by reinvesting the
cash it generates, rather than using cash raised n the capital
markets.
|

AllianceBernstein.
Frank Caruso, chief investment officer of U.S. Growth Equities
at AllianceBernstein.
|
Caruso said that when he and his team meet with management teams of
companies he is invested in or is considering for investment, some
corporate managers are relieved to be able to discuss their plans to
improve and expand their businesses, rather than the details of
quarterly earnings reports.
Selecting companies with strong balance sheets and management teams
that have a proven ability to deploy capital efficiently is very
important, Caruso said, because so many companies “play many games to
manage the optics of their shares,” or make expensive acquisitions
that will juice earnings and sales, but not set the stage for higher
returns on invested capital.
Caruso stressed that he avoids making investment decisions based on
macroeconomic trends and also doesn’t try to predict those trends. He
cited President Trump’s election in 2016 as an example.
“It
was pretty hard not to buy bank stocks” at that time, because “it was
pretty obvious that if the new administration would pursue a tax and
regulatory agenda, banks would be good stocks.”
But
banks have “big balance sheets and low returns,” so they are not
favored by his strategy, he said.
One
company that fits the bill: Nike
Nike
NKE is held by the AB FlexFee
Large-Cap Growth Portfolio and the AB Large-Cap Growth Fund. Caruso
said that for a long time his team observed that the retailers selling
Nike shoes were running at higher profit margins than Nike itself was.
The company is addressing this by moving more of its sales online.
Nike Direct sales for the fiscal second quarter ended Nov. 30 totaled
$2.48 billion, rising 16% from a year earlier. Direct sales to
consumers made up 29% of total sales during the fiscal second quarter,
up from 26% a year earlier.
“You
can look at the prices of companies like Foot Locker
FL and Finish Line
FINL and see that Nike has had
some success,” Caruso said. Shares of Foot Locker are down 22% over
the past three years, while Finish Line’s stock has declined 41% and
Nike’s stock has returned 39% over the same period.
Caruso said a member of his research staff had been looking closely at
new patents filed by Nike about five years ago for robot-based
manufacturing technologies “that in the moment didn’t seem important
to other analysts.” But “the more work he did on the patents, the more
obvious it became that this could help Nike achieve much higher
margins in the future.”
Caruso said the biggest advantage is that Nike can build factories
closer to its customers to save on shipping costs, as well as tariffs
and duties.
Nike
will go through cycles of sales volatility as it competes with Adidas
ADDYY and Under Armour
UA
UAA, but Caruso believes that
the focus on improving profitability makes the company an excellent
long-term investment.
A
company that doesn’t fit the bill: Amazon
There’s no question that Amazon.com
AMZN has been a spectacular
business story and that its stock has been a long-term winner, but
Caruso is not excited by the company’s prospects to improve its
operating profitability.
“The
challenge for us is they continue to throw a lot of capital at buying
and investing in unbelievably ordinary businesses,” he said.
The
Whole Foods acquisition and the company’s other efforts to increase
its brick-and-mortar presence and logistics capabilities are examples
of how “with each new dollar of capital they invest, it appears they
are becoming more like the industries they were trying to disrupt five
years ago,” Caruso explained.
“The
real engine, economically, is Amazon Web Services,” he said. Amazon
Web Services contributed only 9% to Amazon’s total sales during 2017
but accounted for 74% of the company’s operating income.
“Amazon is a great company if you think of exceptionalism in terms of
revenue growth, but it is not in terms of profitability,” Caruso said.
Fund holdings
Here
are the 10 largest equity positions of the AB FlexFee Large-Cap Growth
Portfolio as of Feb. 28:
|
Company |
Ticker |
Share of fund |
Total return - 2018 through April 2
|
Total return - 2017 |
Total return
- 3 years |
|
Alphabet Inc. Class C |
GOOG
|
8.3% |
-4% |
36% |
88% |
|
Facebook Inc. Class A |
FB
|
6.9% |
-12% |
53% |
91% |
|
Visa Inc. Class A |
V
|
5.0% |
4% |
47% |
85% |
|
UnitedHealth Group Inc. |
UNH
|
4.3% |
-1% |
40% |
94% |
|
Biogen Inc. |
BIIB
|
4.1% |
-16% |
22% |
-30% |
|
Apple Inc. |
AAPL
|
3.7% |
-1% |
48% |
41% |
|
Home Depot Inc. |
HD
|
3.6% |
-8% |
45% |
61% |
|
Intuitive Surgical Inc. |
ISRG
|
3.5% |
10% |
73% |
137% |
|
Zoetis Inc. Class A |
ZTS
|
3.1% |
13% |
36% |
79% |
|
Adobe Systems Inc. |
ADBE
|
3.1% |
21% |
70% |
180% |
|
Sources: Morningstar, FactSet |
 |
|
Philip
van Doorn |
|
Philip van Doorn covers various investment and industry topics.
He has previously worked as a senior analyst at TheStreet.com.
He also has experience in community banking and as a credit
analyst at the Federal Home Loan Bank of New York. |
|
Copyright ©2018 MarketWatch, Inc. |