|
Corequity Valuations
Corequity provides
independent, institutional equity valuation research. The results are used
to screen for the best and worst values out of over 500 equities on a
continuous basis. We have accumulated a proprietary database of historical
monthly valuation data. For a brief background...
http://corequity.blogspot.com/2013/05/some-background.html
Real Growth vs Growth Lite
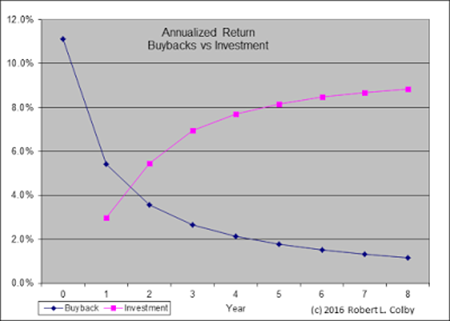
Our Net Profit Test: Comparing Buybacks to Investment shows that a
company’s purchase of its own shares causes a single increase in EPS (as
in simple interest) compared to compounding growth that results from
investment. This graph shows the annualized returns of the two asset
allocation decisions over time. The sinking annualized return on a
buyback explain the relatively low level of return required to grow the
Net Profit at the rate that the buybacks achieved due to the fewer number
of shares.
(See “Net Profit Test: Comparing Buybacks to Investment” at
corequity.blogspot.com)
The sinking annualized return on a buyback explains the relatively low
level of return required to grow the Net Profit at the same rate that a
buyback achieves due to the fewer number of shares.
To illustrate the advantage of Investment over Buybacks, here are two very
similar companies who couldn’t be further apart in their asset allocation
choices. The two are Cracker Barrel (CBRL) and Jack in the Box (JACK).
They are both mid-cap Restaurant companies trading at 19x earnings.
|
Company data as of May 31st |
CRBL |
JACK |
|
INDUSTRY |
RESTAURANT |
RESTAURANT |
|
MARKET CAP |
MID-CAP = $3.5 B |
MID-CAP = $2.4 B |
|
P/E |
19x |
19x |
|
YIELD |
3.1% |
1.6% |
|
2008-15 CASH FLOW - DIVIDENDS |
$1.27 bil |
$1.23 bil |
|
2008-15 STOCK BUYBACKS |
-$0.16 bil |
-$1.20 bil |
|
2008-15 CHANGE IN SHARES O/S |
+7% |
-37% |
|
GROWTH OF EPS 2008-2015 |
+144% or +13.6% pa |
+50% or +6.0% pa |
|
GROWTH IN NET PROFIT “ |
+151% or +14.0% pa |
-4% or -0.5% pa |
|
REQ’D AFTER TAX % TO = EPS GROWTH[1] |
- |
4.8% |
CBRL’s
Cash Flow from Operations less Dividends totaled $1.27 billion from 2008
and 2015. Most of this was invested in its operations as indicated by its
book value per share which grew from $4.15 to $22.45. As a result of this
investment, their Net Profit growth equaled the growth in EPS over the 7
years (+14.0% vs +13.6%) as their shares outstanding increased slightly.
By contrast, JACK bought $1.2 billion of their own stock, reducing their
shares outstanding by 37%. As a result their EPS grew by 6.0% pa entirely
due to buybacks but their Net Profit actually declined by 3.7%, or
-0.5% pa.
The Shareholders of JACK today would have been much better off had
management invested those funds - as much as that may have made the
Sharesellers happy. The company would only have to earn a 4.8% return on
those funds for the Net Profit to match the “growth” in EPS (the Net
Profit Test). That would have generated $64 million more in Net Profit in
2015 alone, or 56% more than they actually achieved ($178 million vs
$115).
Much has been said about the role of share buybacks in executive stock
options. It is therefore interesting to note how much these two companies
compensated their senior management. In 2015, Jack in the Box led by
$16.6 to $13.8 million.[2]
The five year average number is closer but JACK still wins: $9.9 to $9.6
million.
In JACK’s case, management is clearly not being judged by the Net Profit
Test.
|
© 2016 Robert L. Colby |
June 23rd 2016 |
[1]
The required rate of return applied to the buyback funds to grow the Net
Profit at the same rate as the EPS.
[2]
Morningstar
|