Business Day
Big Pharma Spends
on Share Buybacks, but R&D? Not So Much
Fair Game
By
GRETCHEN
MORGENSON
JULY
14, 2017
|

Robert U. Ayres, left, and
Michael Olenick found that companies’ heavy reliance on stock
buybacks hurts corporate performance over the long haul.
Roberto Frankenberg for The New York Times |
Under
fire for skyrocketing drug prices, pharmaceutical companies often
offer this response: The high costs of their products are justified
because the proceeds generate money for crucial research on new cures
and treatments.
It’s a
compelling argument, but only partly true. As a revealing
new academic study shows, big
pharmaceutical companies have spent more on share buybacks and
dividends in a recent 10-year period than they did on research and
development. The working paper, published on Thursday by the Institute
for New Economic Thinking, is entitled “U.S. Pharma’s Financialized
Business Model.”
The paper’s five
authors concluded that from 2006 through 2015, the 18 drug companies in the
Standard & Poor’s 500 index spent a combined $516 billion on buybacks and
dividends. This exceeded by 11 percent the companies’ research and development
spending of $465 billion during these years.
| |
Fair Game
A
column from Gretchen Morgenson examining the world of finance
and its impact on investors, workers and families
See More »
|
| |
|
The authors contend that many big pharmaceutical companies are living
off patents that are decades-old and have little to show in the way of
new blockbuster drugs. But their share buybacks and dividend payments
inoculate them against shareholders who might be concerned about
lackluster research and development.
A few
companies have spent more money repurchasing shares than they
allocated to research over the period, the study found. They included
Gilead Sciences, which spent $27 billion on buybacks versus $17
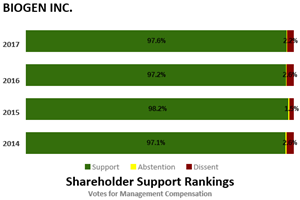
billion on research, and Biogen Idec, which repurchased $14.6 billion
in stock and spent $13.8 billion on research and development.
“The key cause of
high drug prices, restricted access to medicines and stifled innovation, we
submit, is a social disease called ‘maximizing shareholder value,’” the study’s
authors concluded.
This concept, the
authors said, is actually “an ideology of value extraction.” And chief among the
beneficiaries of the extraction are drug company executives, whose pay packages,
based in part on stock prices, are among the lushest in corporate America.
“There’s no
shortage of spending on R&D in the U.S. economy, and no shortage of spending on
life sciences, even though it has declined somewhat in real terms,” one of the
authors, William Lazonick, a professor of economics at the University of
Massachusetts, Lowell, said in an interview. “But there really is very little
drug development going on in companies showing the highest profits and capturing
much of the gains.”
(The other authors
are: Matt Hopkins, Ken Jacobson, Mustafa Erdem Sakinç and Öner Tulum, all
researchers at the
Academic-Industry Research Network, a
nonprofit organization.)
While stock
buybacks appear to be particularly troublesome among drugmakers, big companies
in other industries — in sectors like banking, retail, technology and consumer
goods, among others — are also buying back boatloads of their shares. Through
May, some $390 billion in buybacks have been announced this year, $13 billion
more than at this time in 2016, according to figures compiled by Jeffrey Yale
Rubin at Birinyi Associates, a stock market research firm.
June 28 was the
biggest single buyback announcement day in history. That was when 26 banks
disclosed buybacks worth $92.8 billion, largely a response to having just passed
the stress tests administered by the Federal
Reserve Board. That figure blew past the previous record of $56.4 billion
announced on July 20, 2006.
Many companies
contend that stock buybacks are a great way to return value to their
shareholders. Investors often agree. By reducing the equity outstanding at a
company, the repurchases increase its per-share earnings, often giving a boost
to its stock.
Buybacks made at
low cost can be a fine use of a company’s capital. But when share repurchases
replace a company’s research-and-development spending, that indicates its
management is unable or unwilling to spend on innovation that could generate
future earnings to shareholders.
As the buyback
binge continues, another new academic study shows, a heavy reliance on them
actually hurts corporate performance over the long haul. These researchers found
that the more capital a business invests in stock repurchases based on its
current market capitalization, “the less likely that company is to experience
long-term growth in overall market value.”
“Secular
Stagnation” is by Robert U. Ayres, emeritus professor of economics, political
science and technology management at the global business school Insead, and
Michael Olenick, a research fellow there. It compares the performance of
companies that lean heavily on buybacks with those that do not.
Spending money on
buybacks and dividends has increased among United States companies from
negligible levels in the 1980s, the researchers said, to 38 percent of earnings
in 2000. By 2011, buybacks had grown to 79 percent of earnings, rocketing to 110
percent in 2015.
The
research looked at 1,839 large company
buybacks from January 1990 through last month, examining 6,516
inflation-adjusted transactions. The academics then examined the amounts these
companies had spent on repurchases compared with their current market
capitalizations.
Mr. Ayres and Mr.
Olenick found that 199 companies repurchased shares equal to at least half their
current value. Some 64 companies spent over 100 percent of their current market
capitalization on buybacks.
When the academics
combined these companies’ current market values with the amounts they had spent
on buybacks, the sum showed what the companies should have been worth if they
had invested the money in a money-market account instead.
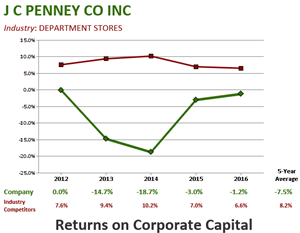
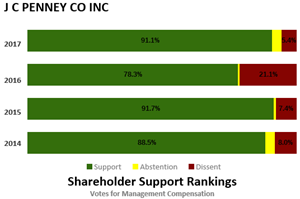
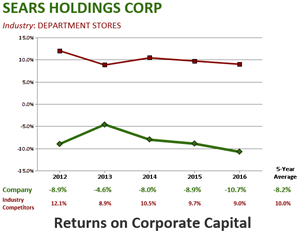
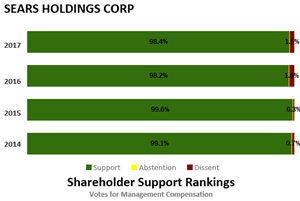
Fifty companies
have spent more inflation-adjusted capital buying back stock than their
businesses are currently worth in market value, the study found. Companies on
this list include HP Inc., J. C. Penney and
Sears Holdings.
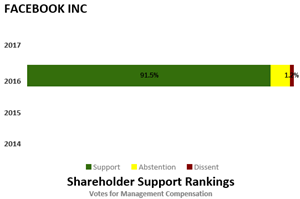
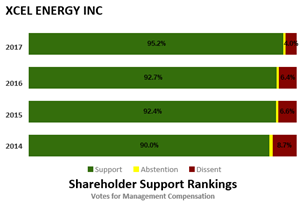
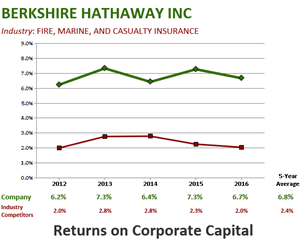
By contrast, the
research identified 269 strong performers that have repurchased stock worth just
2 percent or less of their current market values. They include
Facebook, Xcel
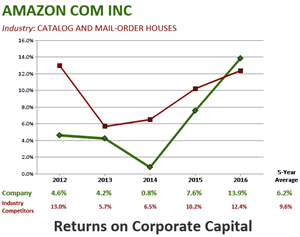
Energy, Berkshire Hathaway and Amazon.
Company executives
who buy back large numbers of shares instead of investing in their businesses
are committing corporate suicide, Mr. Olenick said. “When managers can’t create
value in the business other than buying their own stock,” he said in an
interview, “it seems like it’s time for a management change.”
His co-author, Mr.
Ayres, said he suspected the buyback craze was rooted in executives’ laser focus
on short-term results. “They have short-term expectations,” he said in an
interview. “They’re in their jobs for a few years at most; they’re not really
interested in the long-term future of the company.”
Share buybacks
provide immediate gratification, the stock market equivalent of a sugar high.
That makes them alluring in the short term. Until the crash that usually
follows.
A version of this article appears in print on July 16, 2017, on Page
BU3 of the New York edition with the headline: When Big Pharma Spends,
Research Isn’t No. 1.
© 2017 The
New York Times Company


